

Translating Data, Visualizing the Nation: How Quantitative Data Helped Envision Modern India
By Sayori Ghoshal
In 2022, I began working on an INSBS-funded grant project on the impact of race science and statistics on religious and caste identities in colonial India. Under colonial rule, Indian scientists had rejected the claim that Europeans were racially superior to Indians. However, they had not dismissed race as a scientific object. Instead, from the 1920s, Indian scientists had sought to measure the extent of racial mixing between castes and religious groups. Asking where Indian Muslims had come from and whether Christians were indigenous to the subcontinent, they calculated physical features, blood-group distribution, and genetic variations to produce maps of the nation’s racial and religious past. In the project, I analyzed how science and religion thus came to be co-constituted. That is, how scientific objectivity was built through measuring religious differences, while religious hierarchy came to be constituted as natural through its uncritical conversion to scientific data.
While doing archival research for this project, I focused on government-sponsored, and other institutional publications that sought to study the racial compositions of various social groups in the subcontinent. One of the recurring aspects that caught my attention was the visual representation of statistical data in these publications. Statistically calculated data about the racial identity of communities were often translated into graphs and maps aimed at highlighting the interrelations between contemporary communities within the subcontinent.
Among several such studies, one of the large-scale surveys of the subcontinent’s population was conducted by anthropologist B.S. Guha in collaboration with the 1931 colonial census.
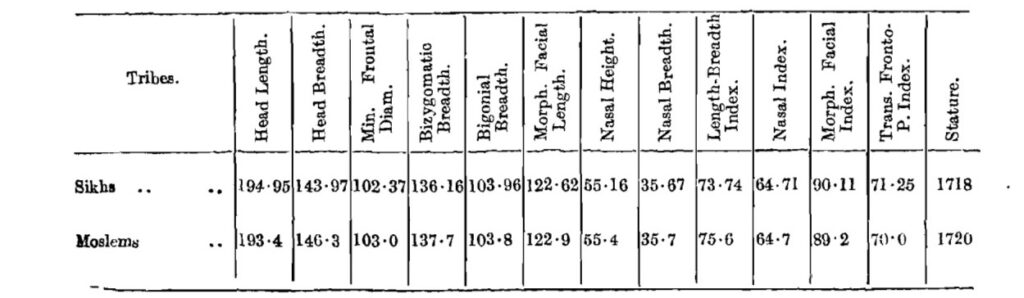
First, some individuals were selected as representative samples from communities to be studies; such as, Punjabi Sikhs and Punjabi Muslims (Moslems; see Image 1). Next, various physical features, such as head length, nasal index, and stature of each individual were recorded and the averages of each physical feature of the two groups calculated. The stated aim of these calculations was to determine the racial relationship – in terms of distinction or homogeneity – between the two groups. However, the uncritical adoption of religious and caste identities in these scientific, disciplinary and institutional studies rendered these social, ethnic identities into communities with coherent, distinct biological pasts. In this way, these studies had the potential to sublate the temporality of religion as belief, as every day and ritualistic practice, and religious conversion into the much longer, human evolution-scale temporality of racial origin, constitution and intermixture.
Thus, the first step in processing the data entailed the translation of religious and caste identities into scientific racial units. This was followed by a second step: the translation of numerical data (of racial features) into the visual representation of racial interrelations between communities and their position within the nation. Once the racial features of each community were calculated and a statistical coefficient assigned to that community, the various coefficients of communities could reveal, race scientists argued, the racial proximity or difference between communities. That is, a lower coefficient would indicate racial closeness or similarity between two religious communities and a higher coefficient would indicate racial distinction. The third step of the process entailed converting these data, which represented the racial relation between communities, into a map of the nation.

The image I have shared here as an example shows the geopolitical boundaries of the subcontinent; and within that, various religious and caste groups, such as: Tamil brahmins, Pathans, Pod and Khasis. These groups were positioned according to their geographical location within the subcontinent. Dotted lines then connected different communities, depending on the degree of their racial similarity. These dotted lines were based on calculations of racial likeness and represented the racial relation between communities. For instance, Tamil brahmins and Saraswat Brahmins were racially related to each other, but Pathans were racially connected with neither. Such maps thus showcased the various religious and caste groups within the political boundary of the subcontinent and represented the racial relation between each community. Although the stated aim of these studies was simply to calculate racial relation between existing communities, these maps had additional consequences. In a colonial context, where anticolonial imperatives were to foreground the nation as a coherent, bounded and ancient entity, the map enabled the imagination of such a nation. At the same time, the representation of each community, and their clusters of related communities within the boundary, made the nation coherent and singular as well as internally variegated according to caste and religious hierarchies. Thus, the modern nation came to be visualized, through scientific data, as coherent and bounded even as existing caste and religious histories and hierarchies came to be incorporated within the modern scientific imagination. The other consequence of the translation of racial data into such maps was to render complex statistical calculations into visually accessible images. While the racial data (image 1) by itself remained incoherent to those not trained in statistics, the consequent visualization and translation of the data into maps (image 2) made the findings of race science and statistics accessible to everyone who could see the image, without the prerequisite of statistical literacy
This line of enquiry has since prompted me to pursue the life of data outside disciplinary spaces and training. How does statistical data enter and circulate in the public domain? How does such data reinforce and/or transform ideas about religious identity, difference and the history of conversion? These historical questions about data along with its translation into other media and their impact on ideas about religious, racial, caste and ethnic identities and differences can further illuminate our understandings of the potentials and limitations of data in the contemporary.

Dr. Sayori Ghoshal is a historian of the biological and social sciences focusing on modern South Asia. Across all her work, Sayori is interested in how communities form social identities. Her current book project, tentatively titled “Calculating the Nation: How Difference became Minority in Modern India” traces the formation of minority as the conceptual foil against which the modern postcolonial nation emerged. In addition, Sayori’s research on contemporary politics of Hindu nationalism, and the intersection of religious, caste and racial differences have been published as journal articles in the Economic and Political Weekly and History Compass as well as an essay in an edited volume, Nation, Nationalism and the Public Sphere.